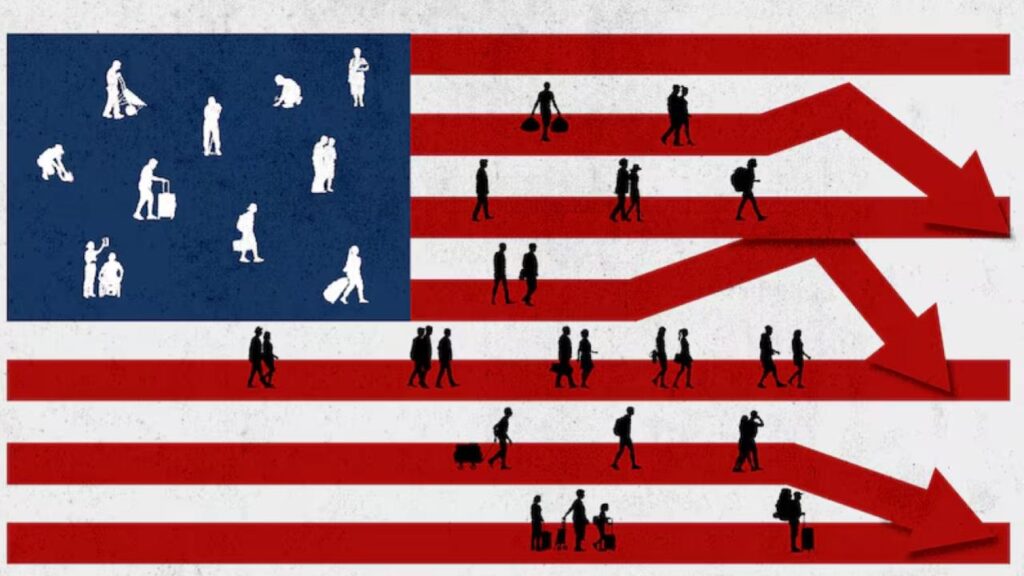
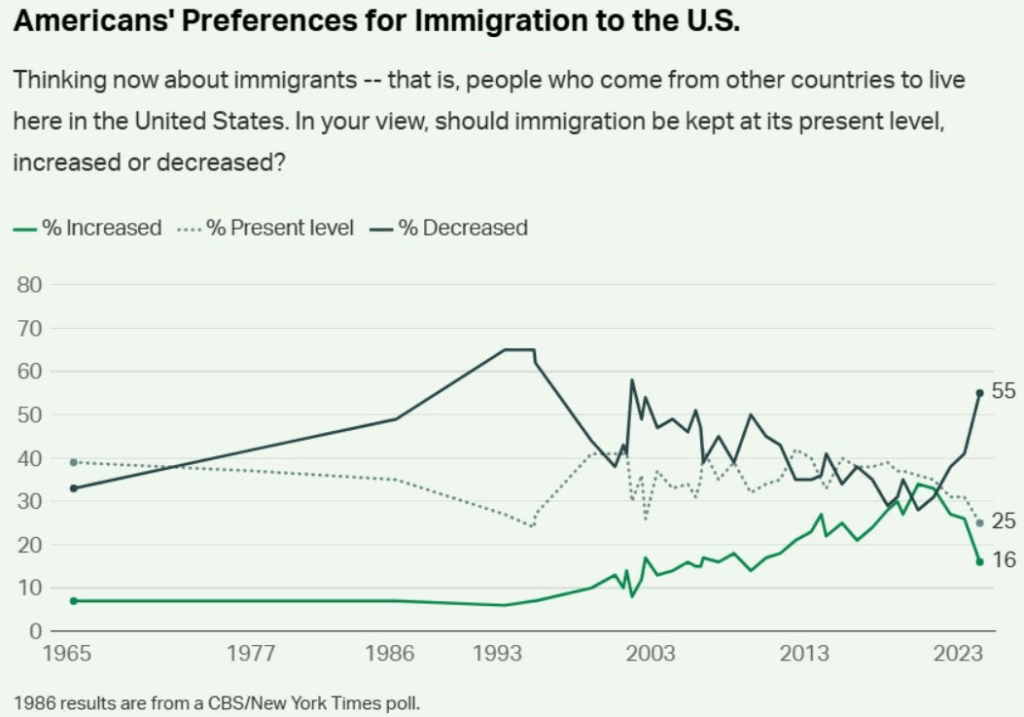
For the first time in over 50 years, the U.S. is headed toward a net loss of immigrants in 2025—a dramatic pivot from decades‑long growth. We’ll break down the economic and demographic consequences beneath stark headlines.

U.S. Could Lose More Immigrants Than It Gains
| Insight | Stat |
|---|---|
| First net immigration decline in 50+ years | ▼ Foreign‑born workforce dropped by 1M since March 2025 |
| Immigration drove 84% of population growth ‘23–‘24 | Net +2.8 M migrants accounted for 84% of +3.3 M growth |
| Negative migration could shave 0.2–0.3 pp off 2025 GDP | Trump “low” scenario estimates |
The U.S.’s demographic engine, already sputtering from low births, is losing its fuel. A net migration year can reshape decades—economically, socially, politically. If current policies don’t change, we’re staring at slower growth, rising costs, tighter budgets, and communities in retreat.
Why Now?
As of mid-June 2025, economists warn that restrictive policies—tight on legal visas, expanding deportations, ending statuses for Haitian and Cuban nationals—could shift the U.S. from importing to losing people. That’s after a record-breaking immigration surge: 2.8 million migrants in 2023–24, fueling 84% of U.S. population growth.
Economic Shockwaves
Labor Shortfalls & Inflationary Pressure
If the foreign‑born workforce contracts by over a million since March, key sectors—agriculture, hospitality, construction—are already feeling pressure. Employers report fewer workers; wages inch up. That labor crunch could ripple into food and housing prices.
Slower GDP & Weaker Investment
Under the “Trump‑low” forecast, net migration could hit –740,000 in 2025 and –230,000 in 2026—sapping 0.2 pp from growth in 2025, with another 0.1 pp drip from shy consumer and business spending. Longer‑term, the cumulative effect could shave up to 3 pp off GDP by 2034 vs more open‑border scenarios.
Strained Social Safety Net
Fewer working-age migrants limits payroll tax intake, even as retirees swell. Without immigration, the worker-to-retiree ratio could tumble from ~2.9 today to 2.3 by 2035—and hit 2.0 by 2060, threatening Social Security and Medicare funding.

Demographics & Communities at Risk
- Metro areas rebound: Immigration fueled population gains in 54 of the 55 top metro regions from 2023–24.
- Particularly fragile counties: More than 450 U.S. counties would’ve shrunk in 2023–24 without immigrants.
- Aging America: With fertility hovering near 1.6 births per woman—well below the 2.1 needed to replace population—immigration remains the main buffer to demographic decline.
Real Voices & Reactions
- Farms & hospitality are warning of “harvests rotting in the field” and service shortages .
- Economists across lines warn this is no spillover—it may press the Federal Reserve to revise output and inflation forecasts.
What It All Means
1. Business woes deepen
Tighter labor translates to slower productivity, delayed projects, and pricier services—from food to construction.
2. Budget gaps widen
Tax revenues weaken, even as social program strains intensify with an aging populace.
3. Aging accelerates
Without immigration, the U.S. may tip into a demographic quagmire within a decade—stagnant growth, eldercare overload, dwindling innovation.
4. Policy crossroads
Some voices call for targeted temporary visas (e.g. for agriculture and child care) or legal status for long-term migrants. Others argue for even harsher enforcement. Either choice shakes the economic balance the nation’s relied on since mid-century.
FAQs
Will this really cause population decline?
Not immediately. But with births below replacement, declining immigration sets the stage for total population shrinkage by the early 2030s—CBO says by 2033.
Are wages likely to rise?
Yes, especially for low-skilled labor. But firms may pass costs to consumers, pushing inflation modestly higher .
Can policy reverse this?
Yes. Easing visa caps, restoring humanitarian protections, or legalizing long-term undocumented workers could flip the trend—if implemented in time.


